Case comparison#
The case comparison view lets you place several cases side by side, inspect how their setups differ, visualize their results together, and chart their data on shared axes. It is built for studying trends across a parameter sweep or weighing one design variant against another. The comparison table that drives each chart can also be exported to CSV for your own analysis and reporting.
Accessing the comparison view#
There are two ways to open the comparison view:
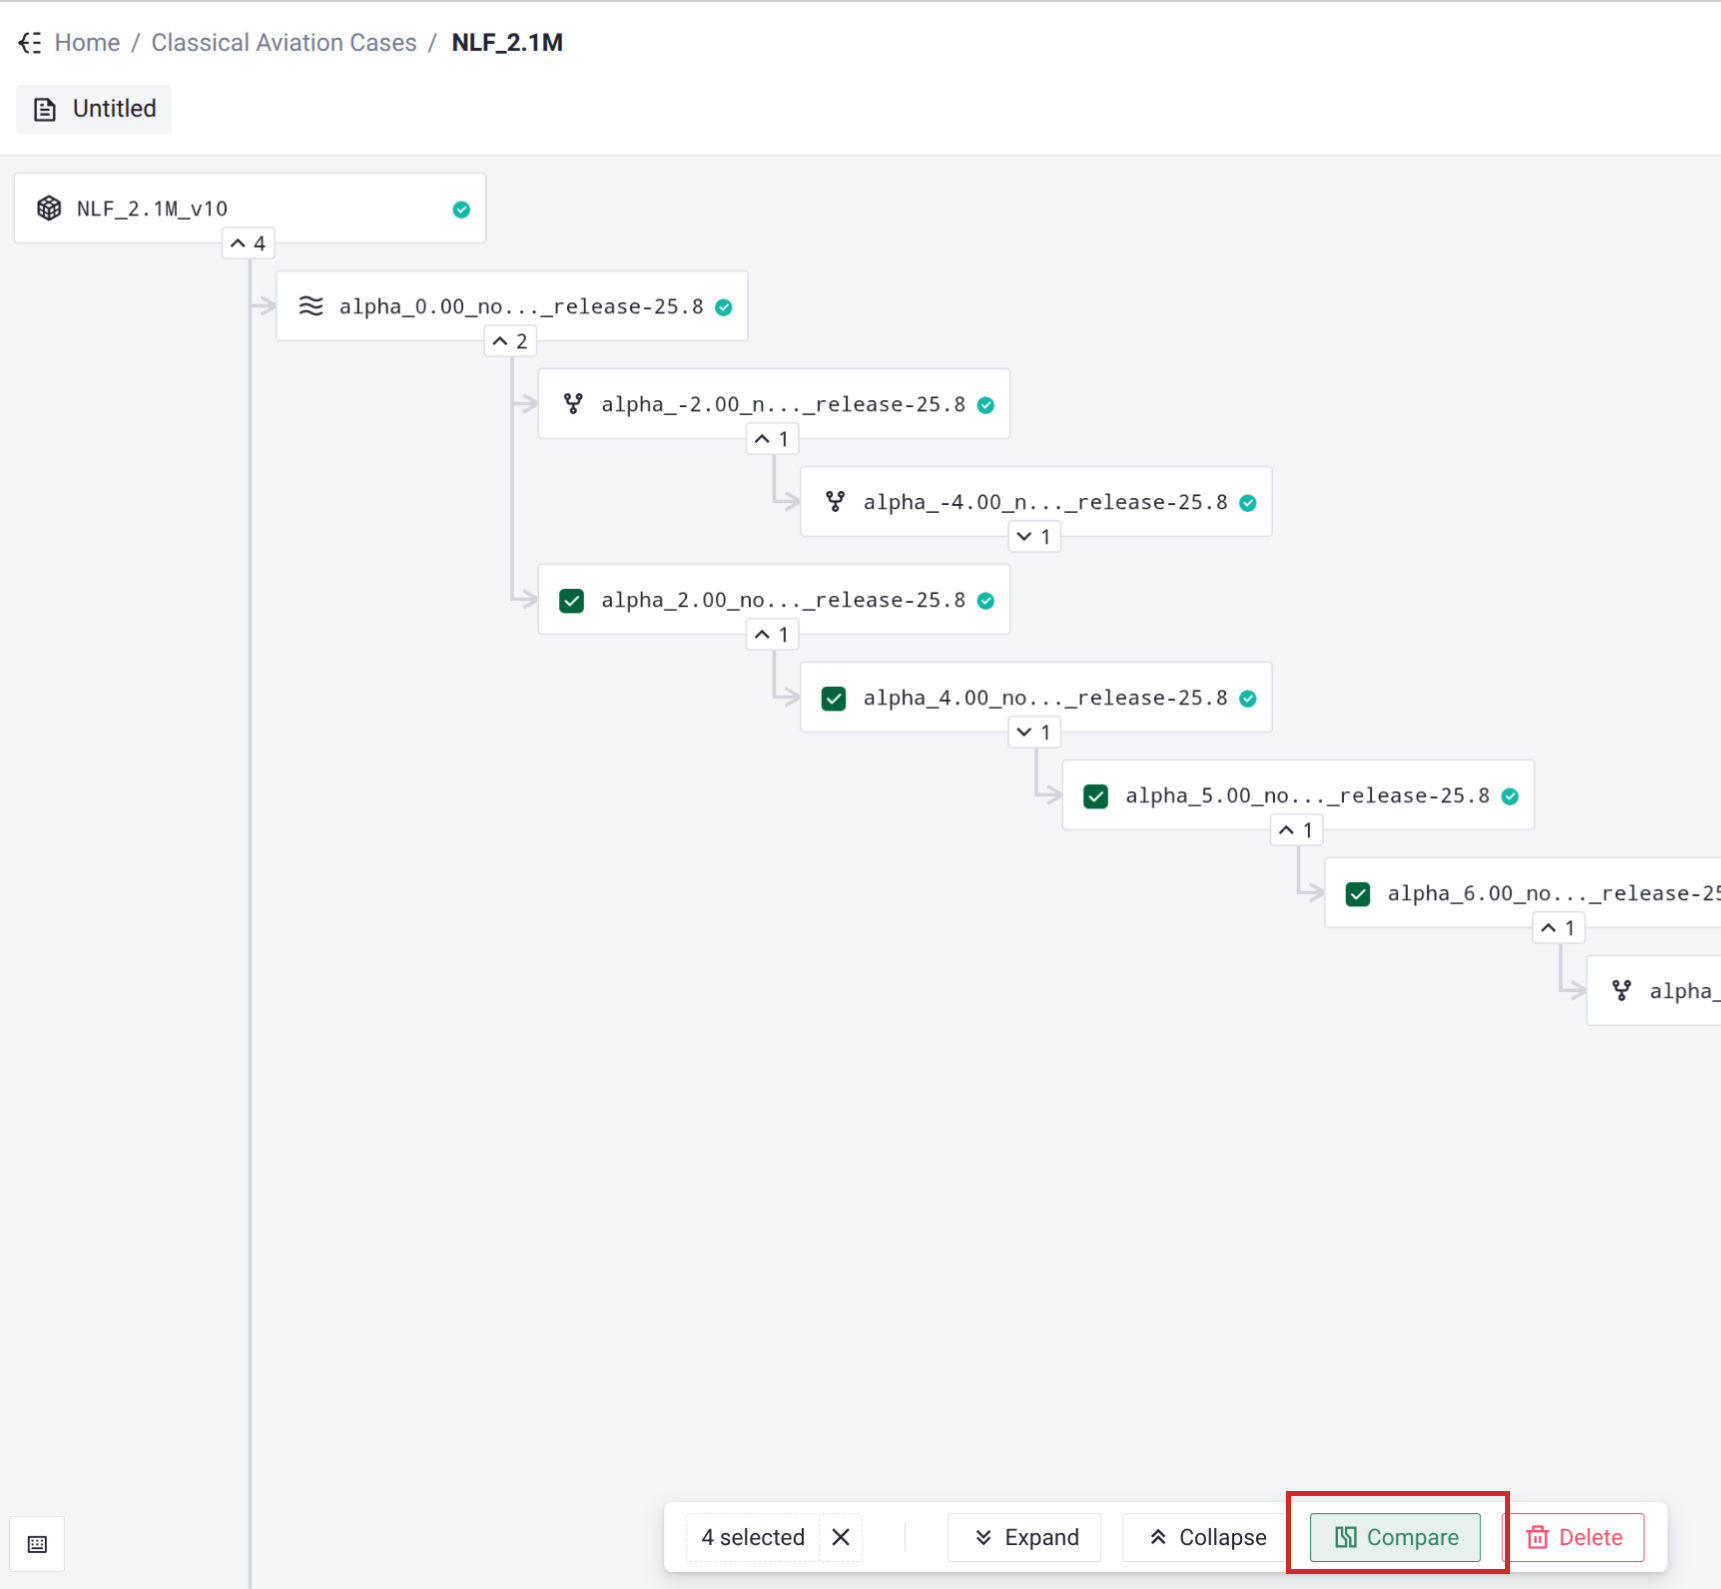
From a project, select two or more cases in the project tree and click Compare in the action bar at the bottom of the view. The comparison opens pre-loaded with the cases you selected.
From the navigation sidebar, open Case compare. The view opens with an empty workspace into which you add the cases yourself.
The view is organized as three stacked areas, from top to bottom: the case panel, the visualization panel, and the charts.
Building the comparison set#
Adding cases#
Use Add case to open the case picker. Cases are grouped by their project and can be filtered with the search box. Select the cases you want and confirm; a comparison needs at least two cases, and the view reminds you (“Please select at least 2 cases.”) if fewer are chosen. You can return to Add case at any time to bring more cases into the comparison.
The case panel#
Every case you add appears in the case panel on the left. The panel gives you the following controls:
Control |
Description |
|---|---|
Checkbox |
Show or hide the case in the configuration diff and the charts without removing it from the comparison. |
Reference |
A radio button on each case. Exactly one case is the reference, and all other cases are compared against it (both in the configuration diff and in the charts). The reference case carries a Reference badge. |
Remove (×) |
Take the case out of the comparison entirely. |
Expand all / Collapse all |
Open or close the detail section of every case at once. |
Expanding a case reveals its identifying metadata and its full simulation configuration, so you can confirm exactly what is being compared:
Solver Version
Mesh ID, linking to the mesh asset in the workbench.
Parent ID, linking to the parent case when one exists.
For every non-reference case, each metadata field also shows how it relates to the reference: (no change) when the values match, otherwise the reference value is shown alongside, so differences in solver version, mesh, or lineage are immediately visible.
Comparing case setups#
The expanded detail of each case includes a read-only view of its simulation configuration:
The reference case shows its complete configuration.
Every other case shows an inline diff of its configuration against the reference, with added and removed settings highlighted in place.
This makes it easy to see precisely which inputs were changed between cases before you interpret any difference in their results.
Visualizing results side by side#
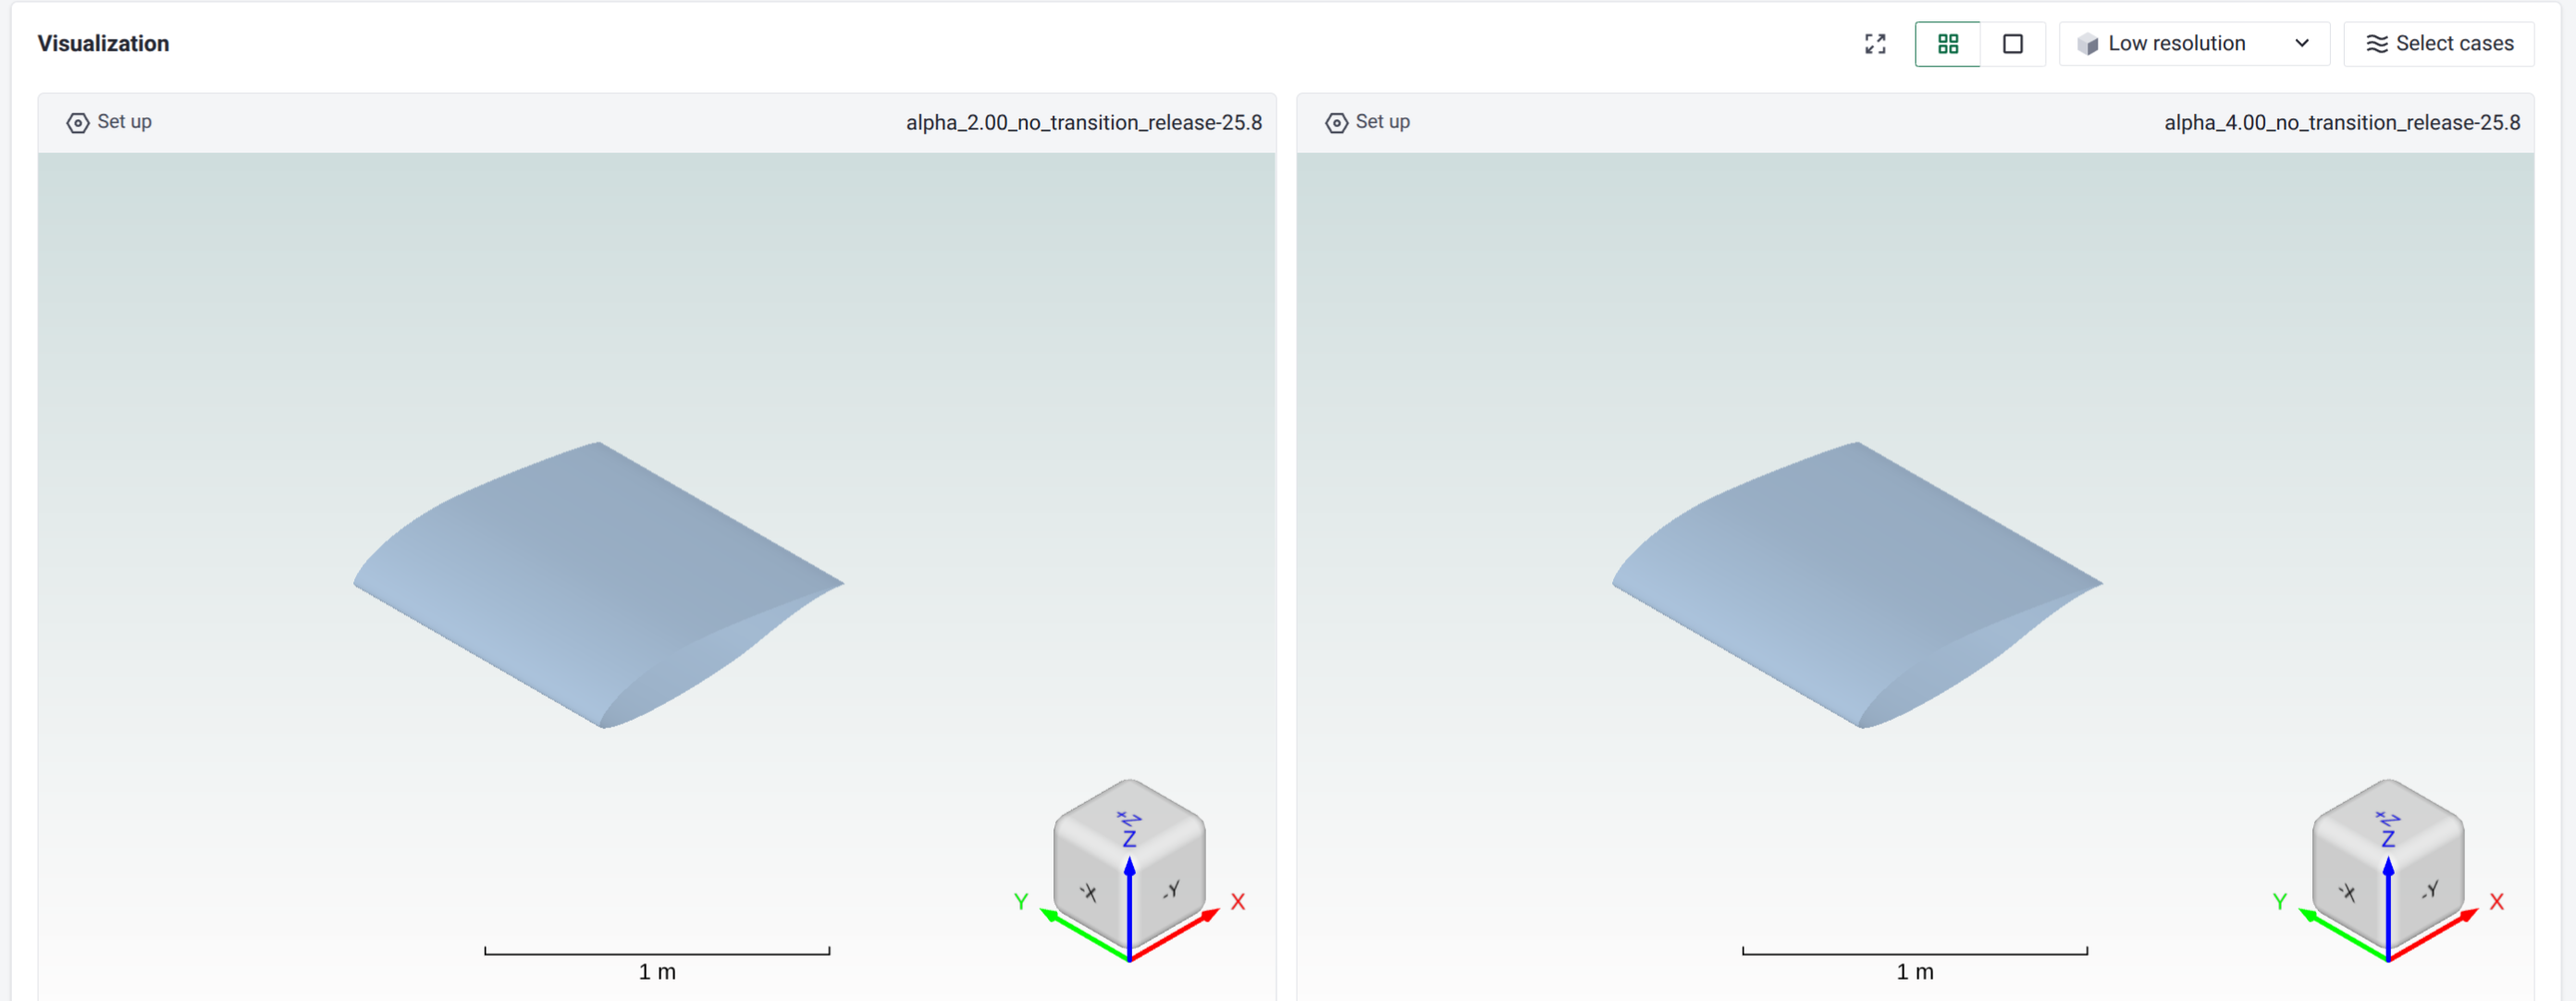
When the comparison contains cases, a visualization panel lets you render their flow fields next to each other.
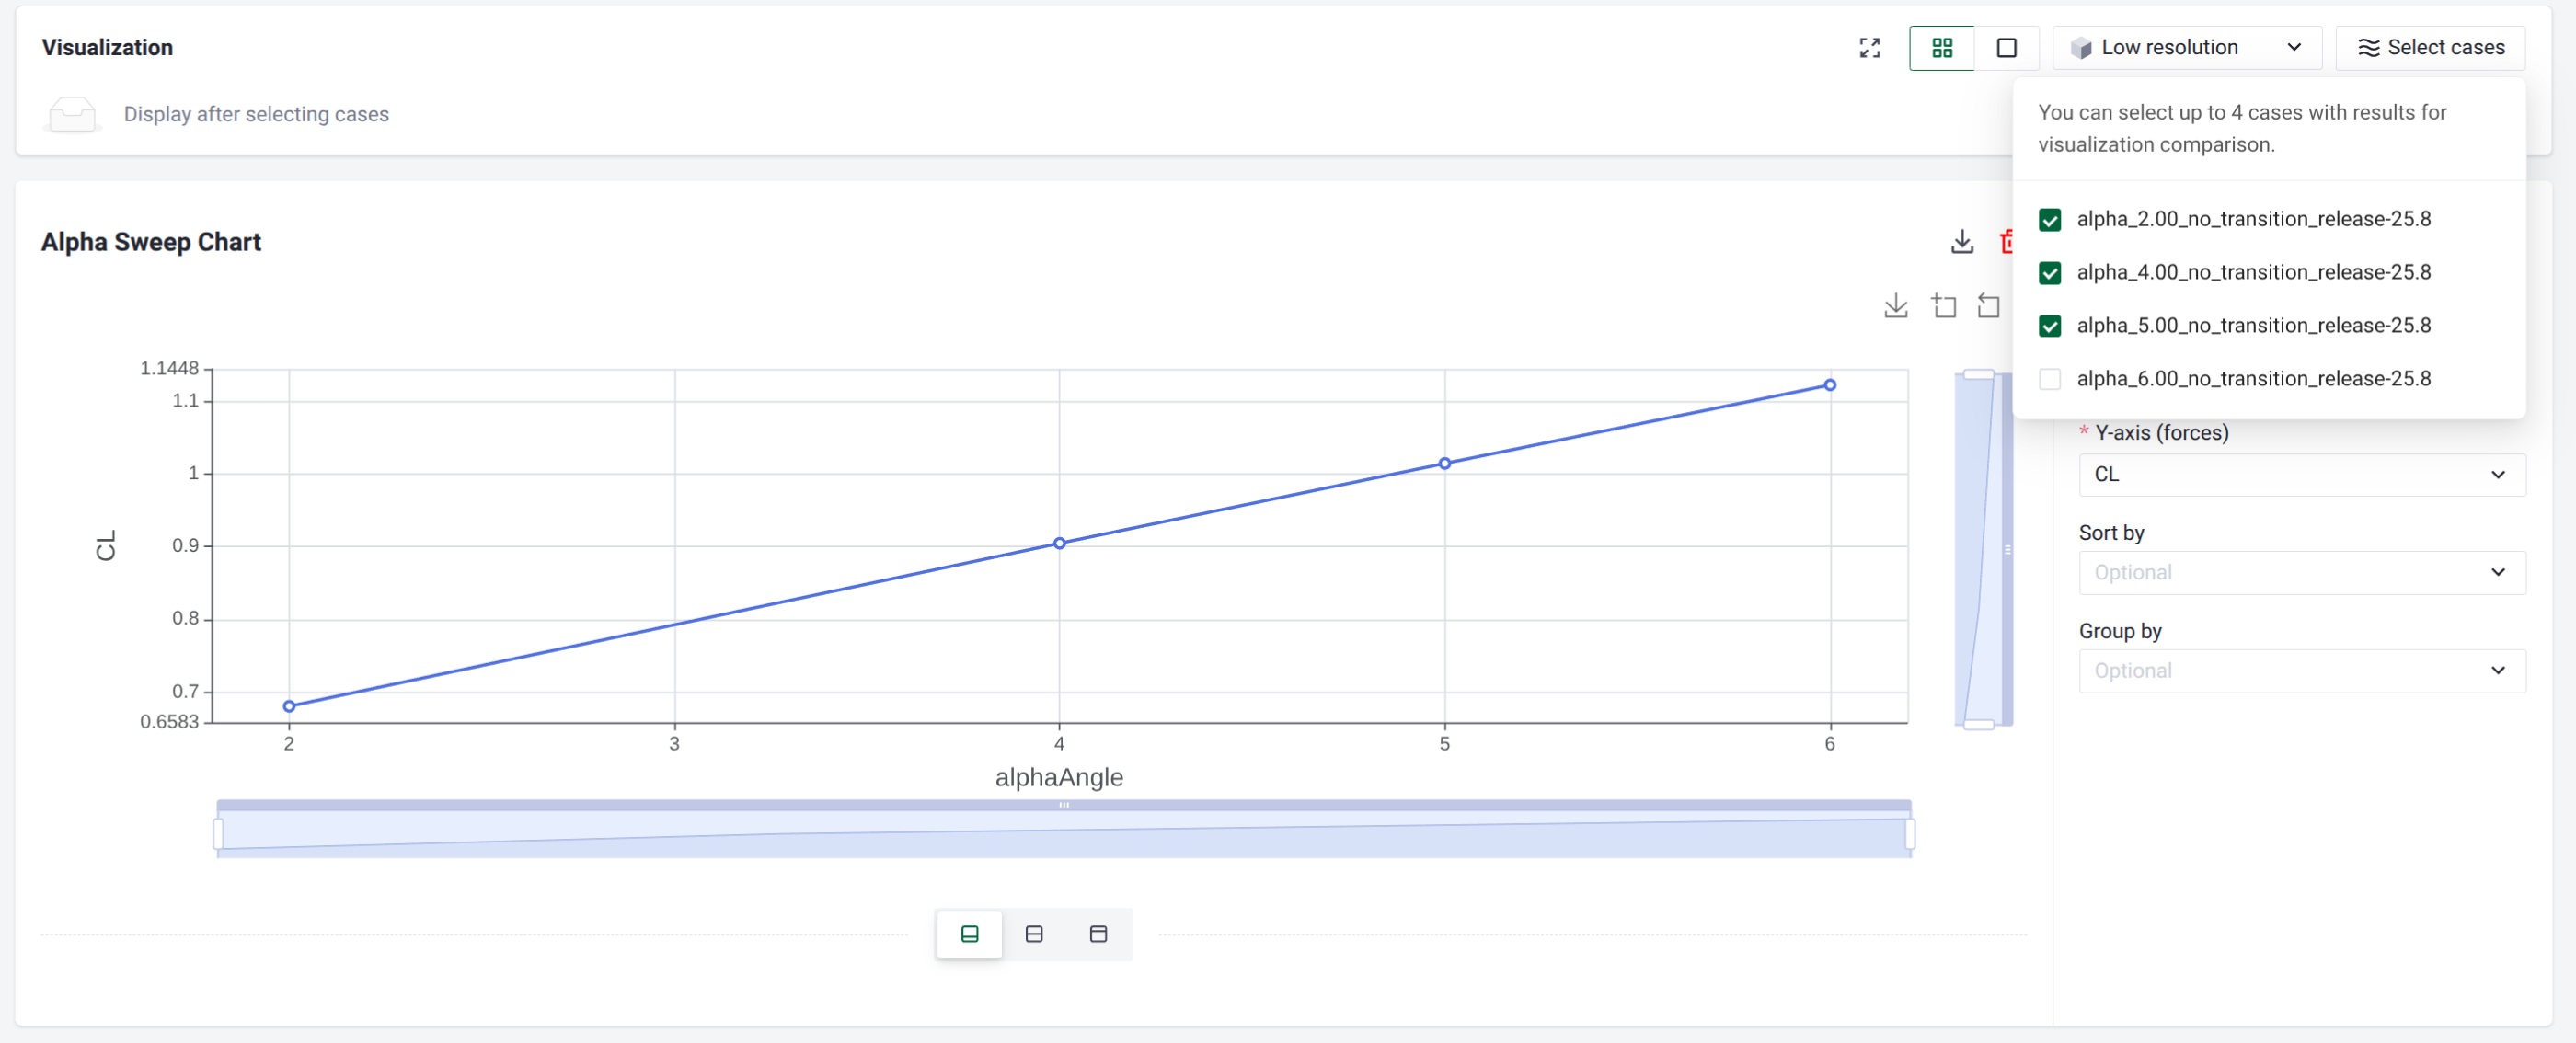
Use Select cases to choose the cases to display. You can select up to four cases, and only cases whose visualization results have finished processing are selectable; the rest are disabled with a note that no visualization results are available yet.
Choose a layout: Grid view (2x2) shows all selected cases at once, while Single view shows one case at a time with a tab per case.
The cameras of all views are synchronized: rotating, panning, or zooming one view moves the others to the same vantage point, so you always compare the same region.
A resolution control switches the rendering between Low resolution and High resolution.
A fullscreen toggle expands the panel to fill the window.
Each view offers the same field, slice, isosurface, and streamline controls as the single-case visualization tool, reached through the Set up control in each view. See Visualization for the available rendering options.
Charting results#
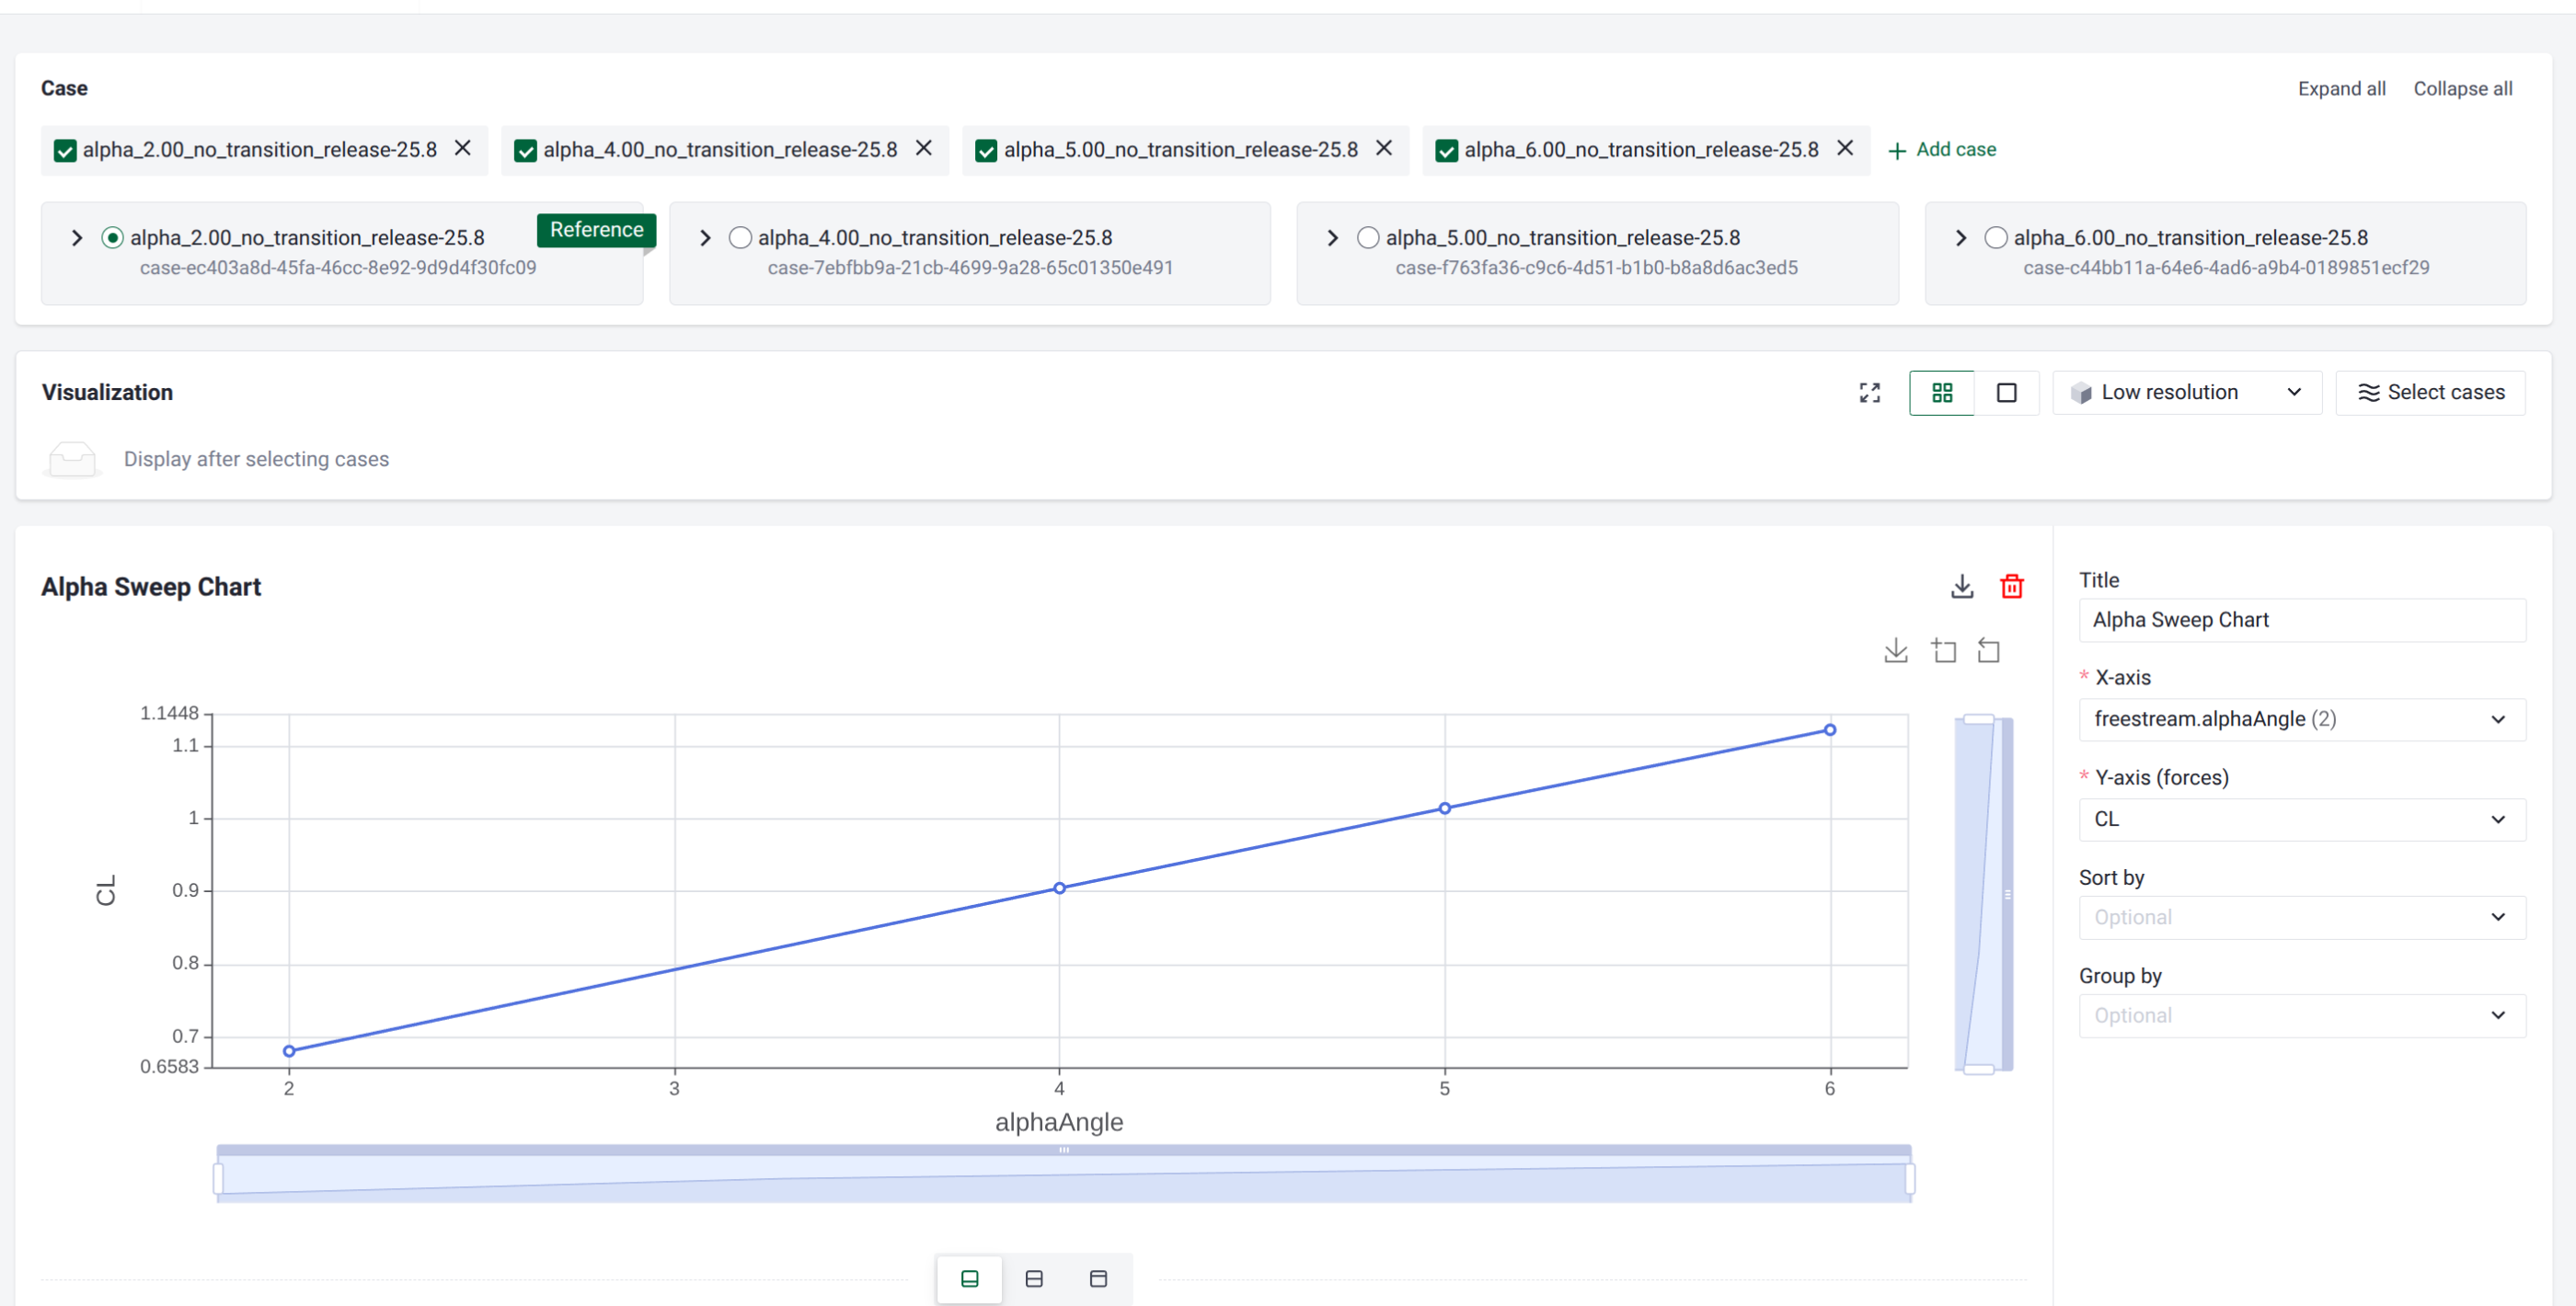
Once a reference case is selected, you can build one or more charts with the XY plot and Series plot buttons. Each chart has its own Title, a layout selector, a Download CSV button, and a delete control, and several charts can be stacked in the same comparison.
XY plots#
An XY plot draws one point per case, which is ideal for parameter sweeps (for example a force coefficient against angle of attack across cases).
Field |
Description |
|---|---|
X-axis |
A case property (such as name or tags) or any value from the simulation configuration, selected from a searchable tree (for example |
Y-axis (forces) |
The force coefficient to plot: |
Sort by |
Optional. Orders the points by one of the force coefficients above. |
Group by |
Optional. Splits the cases into series by a case property or configuration value. |
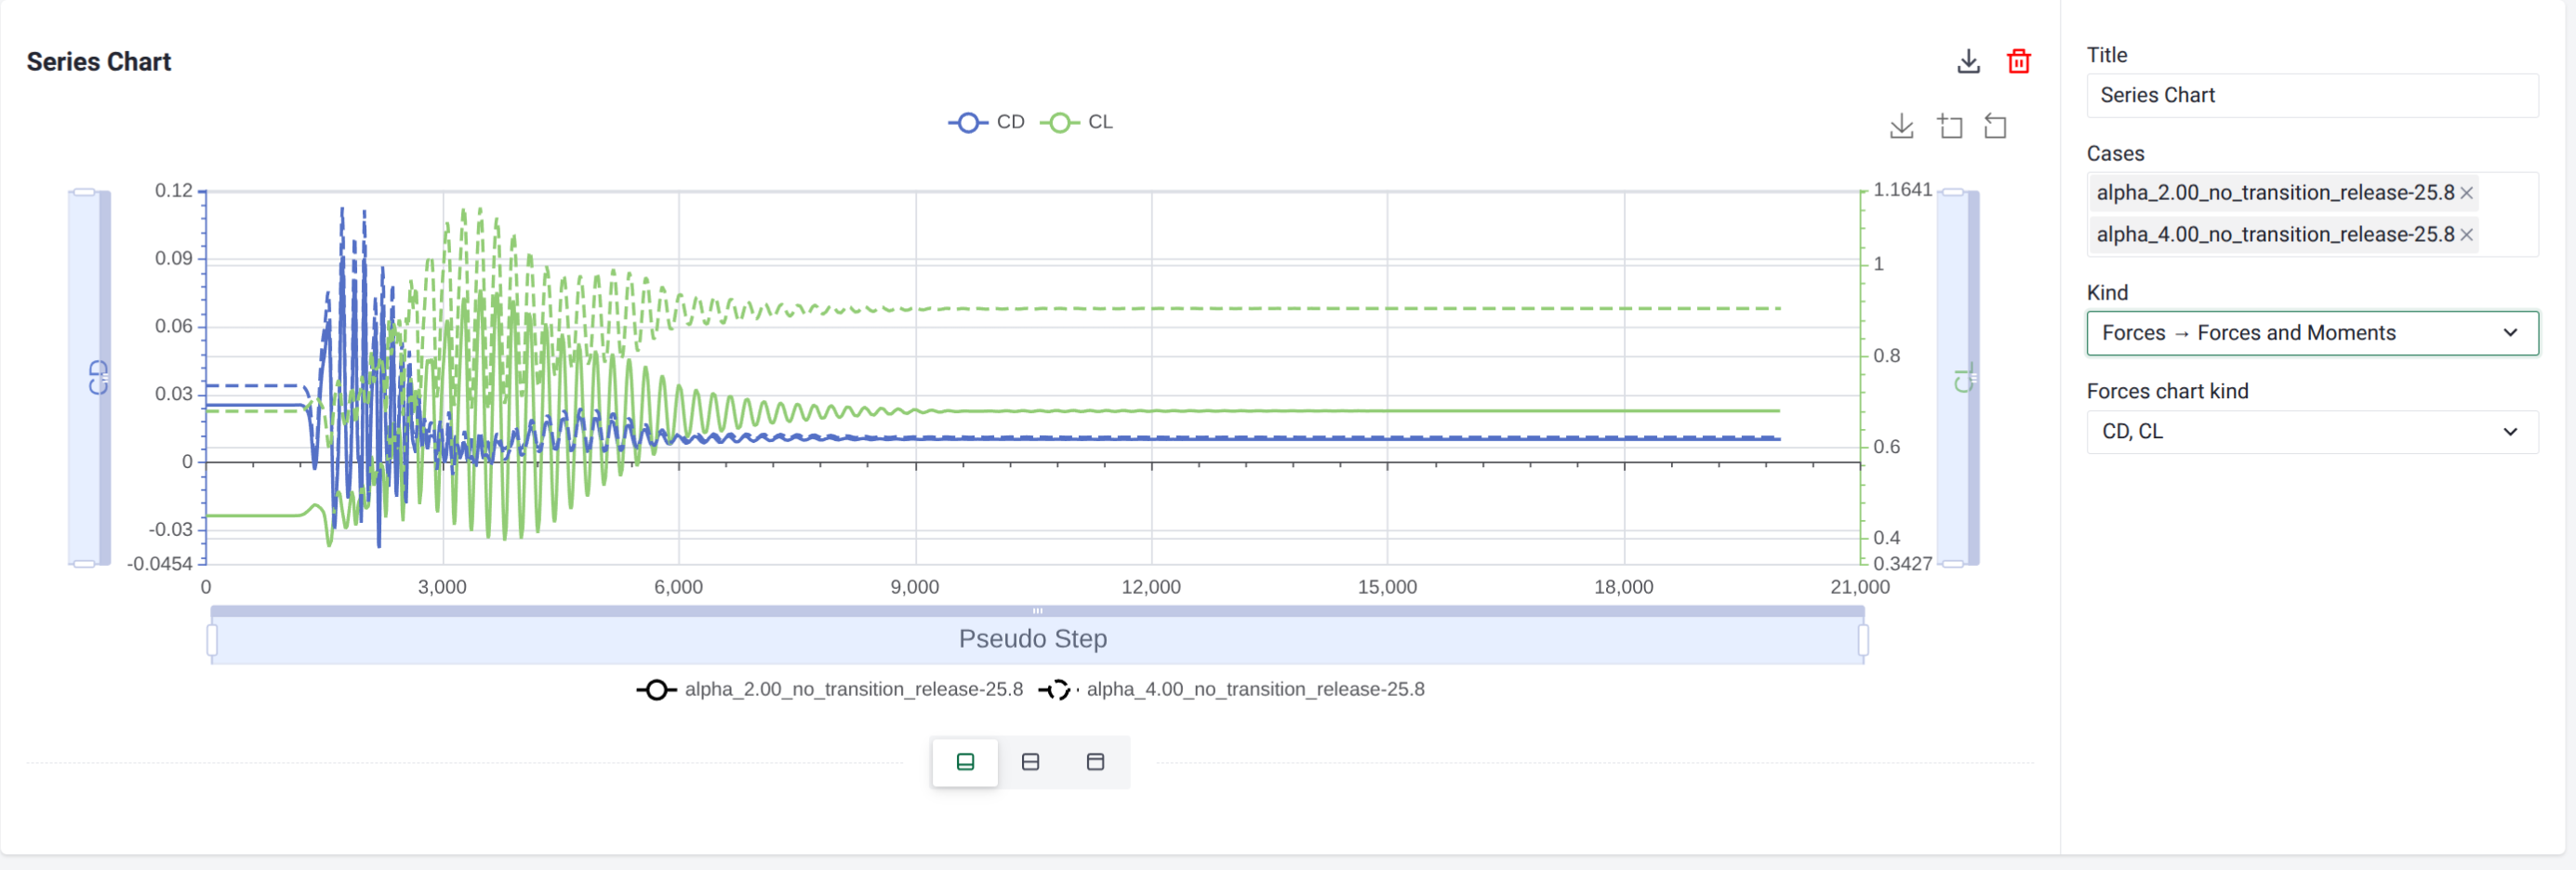
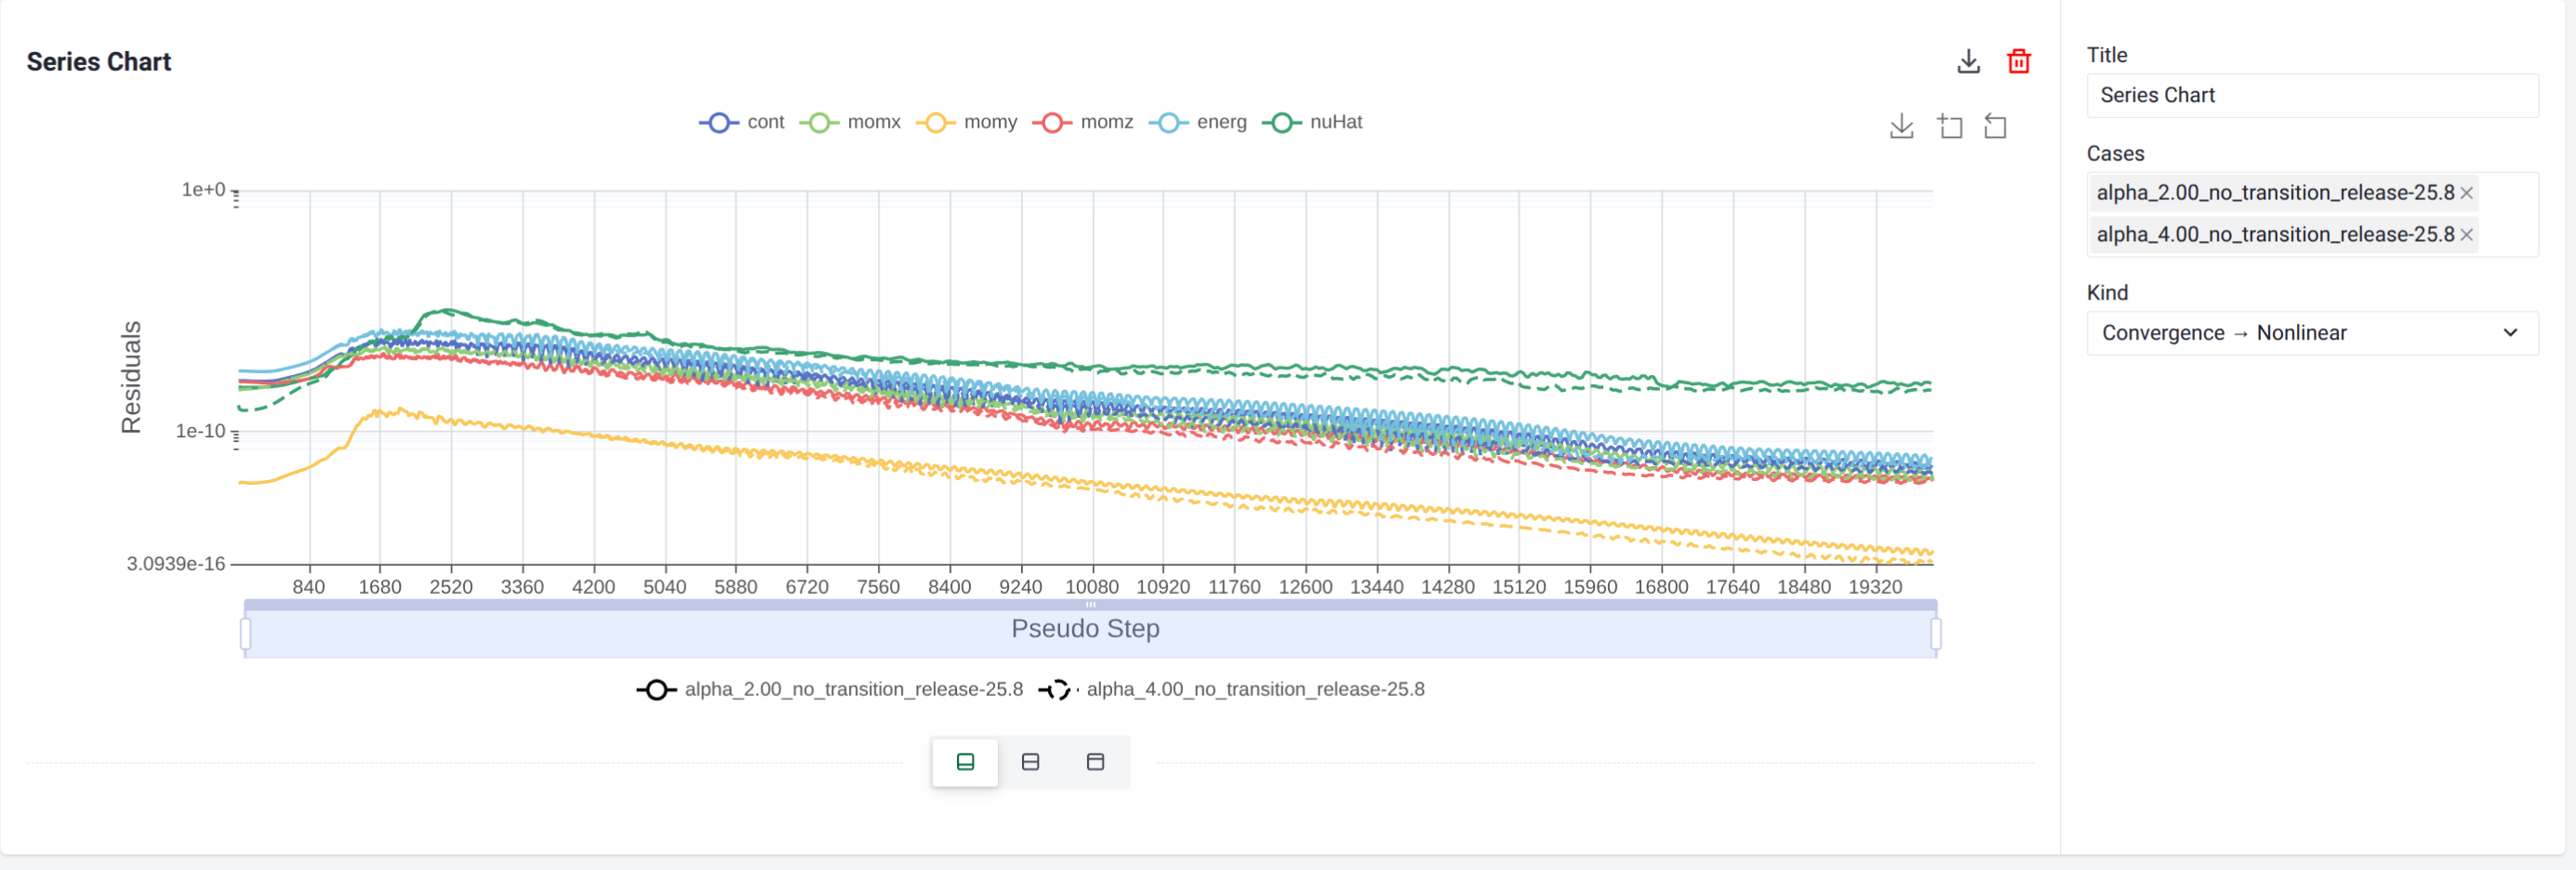
Series plots#
A series plot draws a curve over the solver steps, with one curve per selected case, mirroring the plots on the Convergence and Monitor pages.
Field |
Description |
|---|---|
Cases |
The cases to include in the plot. |
Kind |
The quantity to plot over the steps: Convergence → Nonlinear (nonlinear residuals), MinMax (state-variable bounds), or Forces → Forces and Moments. |
Forces chart kind |
Shown only for Forces and Moments. Selects which coefficients to plot: CD, CL, CF, or CM. |
For an unsteady convergence plot, an additional absolute / relative toggle controls whether residuals are shown on an absolute or a normalized scale. Each case is drawn with its own line style so the cases stay distinguishable across the shared axes.
See also
The series plots reuse the same data as the standalone analysis tools. See Convergence for residual behavior and Monitor for forces, moments, and other tracked quantities.
Chart and table layout#
Each chart can be shown in three layouts. The control is the row of three small layout icons centered on the dashed divider directly below the chart (not in the configuration panel on the right). The icons have no text labels, so hover over one to see its name. From left to right:
Chart: the plot only. This is the default, which is why a newly created chart shows no table.
Chart and Table: the plot together with the underlying data table.
Table: the data table only.
To reveal the table, click the middle icon (Chart and Table) or the right icon (Table).
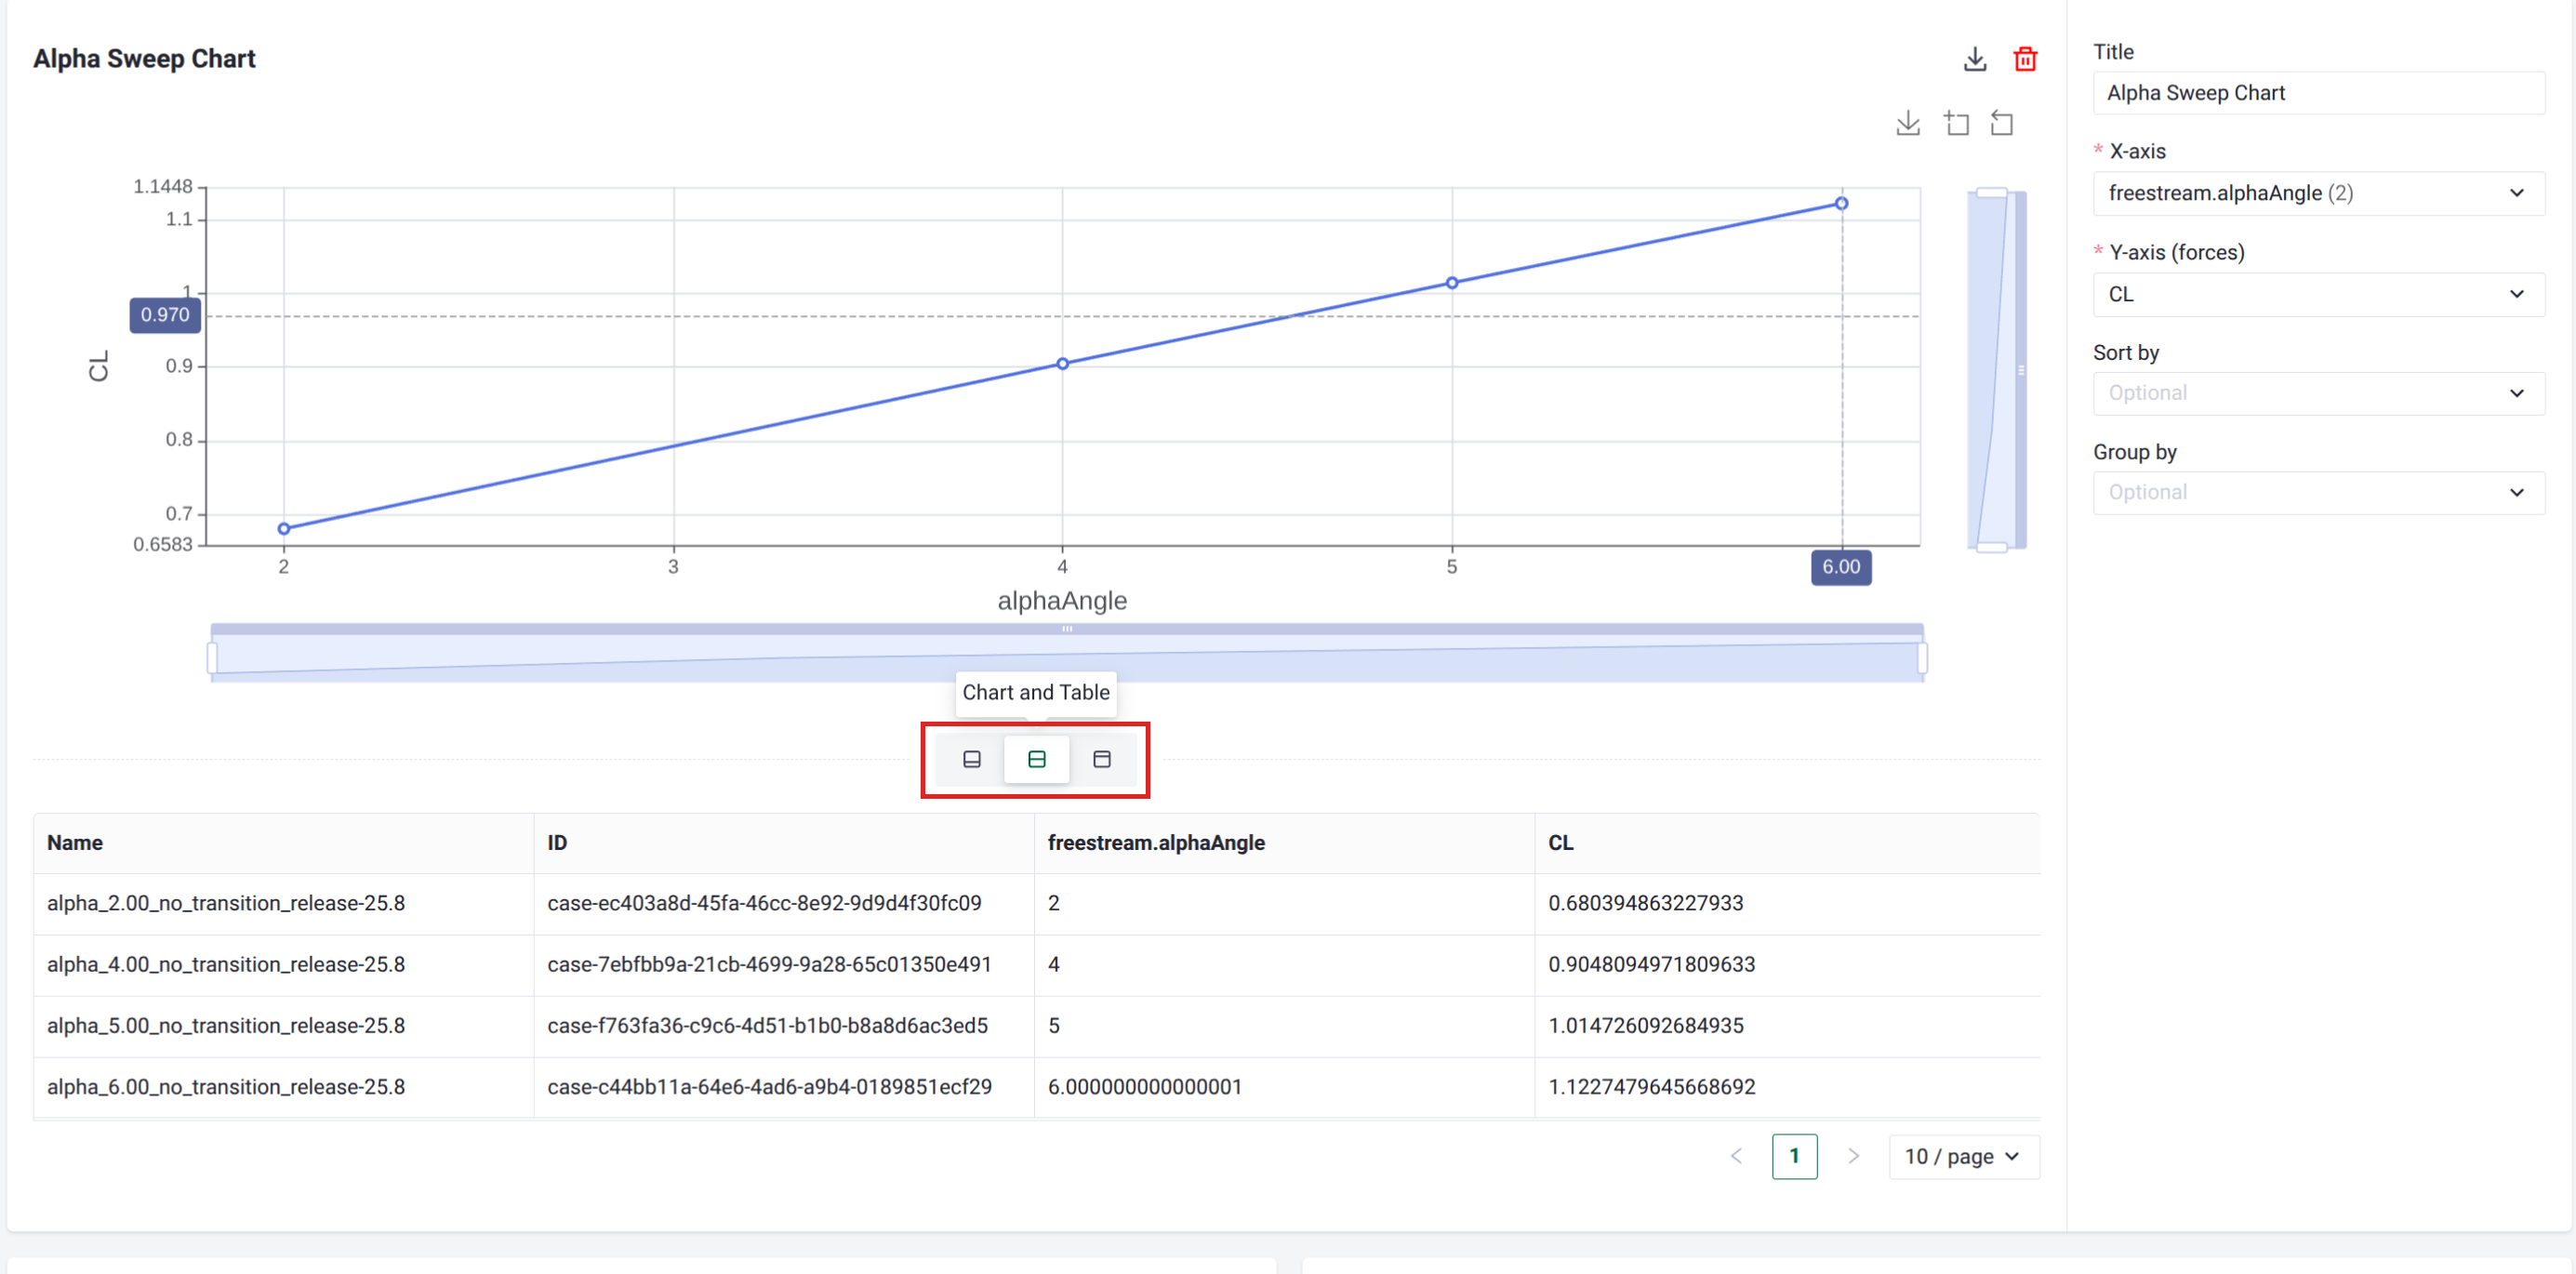
The table holds the same data that drives the chart. For an XY plot this is one row per case with the selected X and Y values; for a series plot it is one row per solver step, with a column group per case.
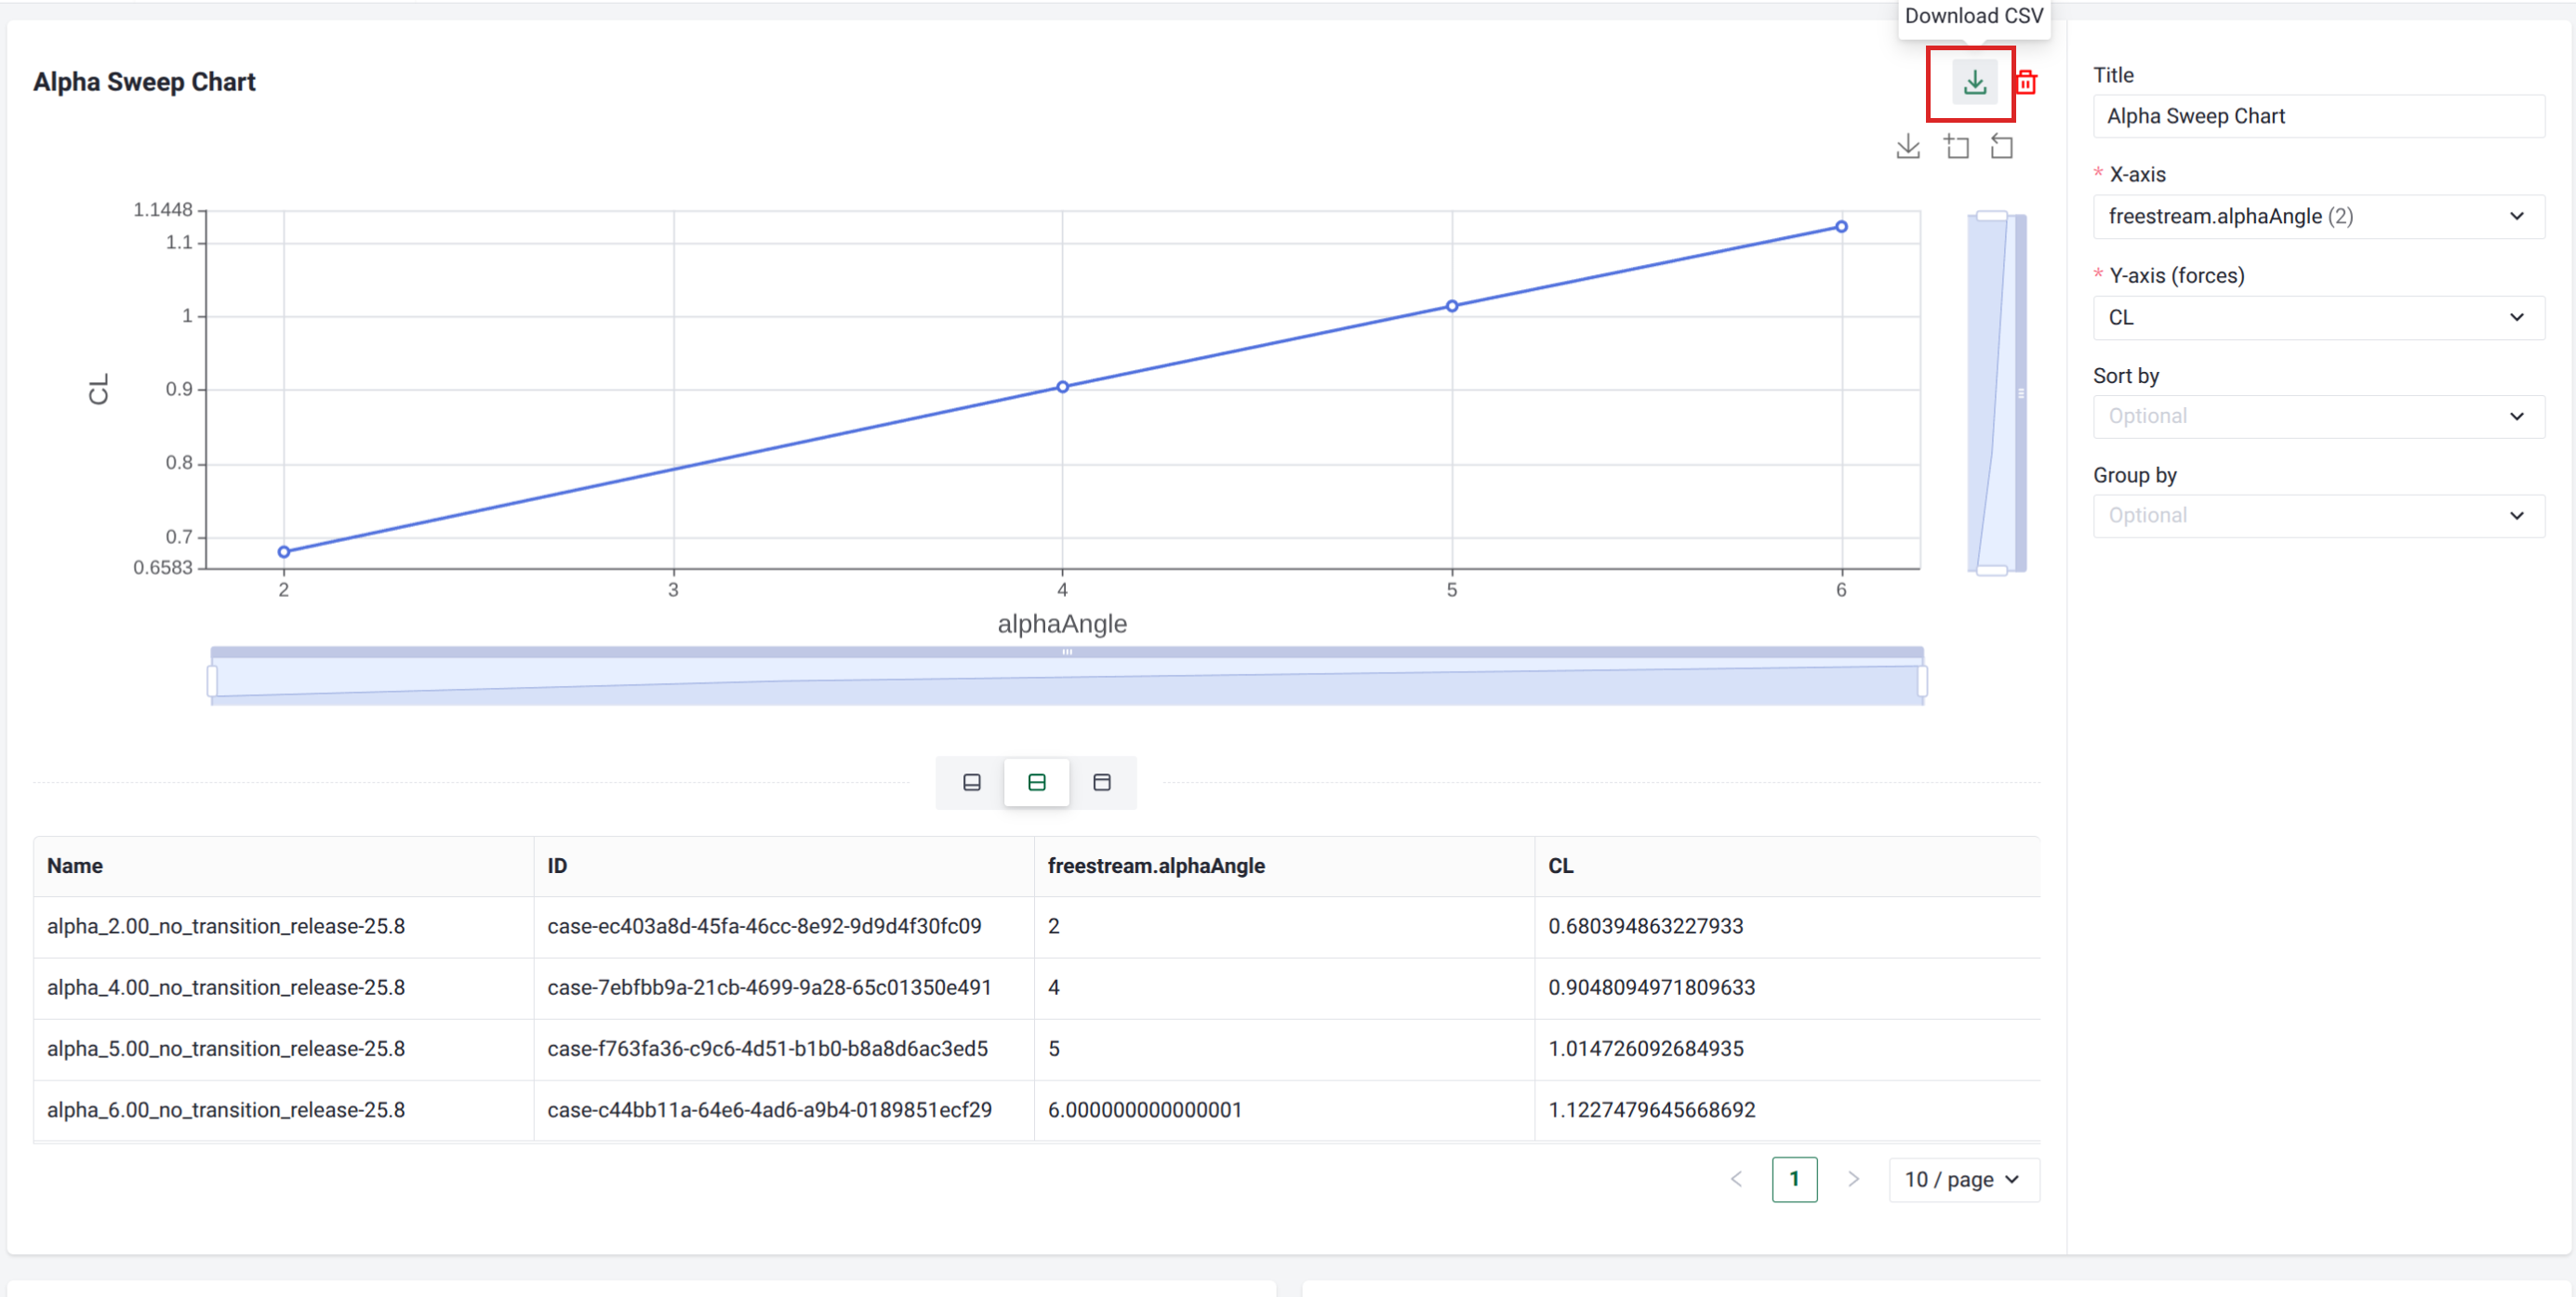
Downloading the table as CSV#
Each chart has a Download CSV button in its header, just to the left of the delete (trash) icon; hover over it to see the Download CSV label. It works in any of the three layouts, so you do not need to switch to a table view first, and it exports the chart’s data table exactly as it would appear, including the grouped column headers, to a CSV file.
The file is generated in your browser, so no case data leaves your session during the export.
The file is named after the chart’s title, with spaces and any characters that are not valid in file names replaced by underscores. For example, the default XY chart titled Alpha Sweep Chart downloads as
Alpha_Sweep_Chart.csv, and a series chart titled Series Chart downloads asSeries_Chart.csv. Only when the title is left blank does the name fall back tocase_compare_table.csv.The button is disabled when the chart has no data to export.
The file is written as UTF-8 (with a byte-order mark) so it opens cleanly in spreadsheet tools.
The columns match the table for that chart. For an XY plot the file has one row per case, with the case identity followed by the selected axes. For example, the Alpha Sweep Chart above (X-axis freestream.alphaAngle, Y-axis CL) produces these columns:
Column |
Contents |
|---|---|
|
The case name |
|
The case ID |
|
The selected X-axis value |
|
The selected Y-axis force coefficient |
A series plot instead has one row per solver step, with a column group per case. That grouping is written as a two-row header, with each case name spanning its columns.
Note
The export captures whatever is currently in the table, so configure the chart (cases, axes, and plot kind) the way you want before downloading.