Unstructured datasets#
When using Tidy3D’s heat solver the user can request to return simulation results on original unstructured grid. In Tidy3D such information is handled using classes TriangularGridDataset and TetrahedralGridDataset. In this tutorial we provide an overview of their basic functionality.
Basics#
In their core TriangularGridDataset and TetrahedralGridDataset store three fields:
points: coordinates of all grid points as a PointDataArray (dims=(index, axis)). TriangularGridDataset stores only in-plane 2d coordinates (axis = 0, 1), while TetrahedralGridDataset stores 3d coordinates (axis = 0, 1, 2).cells: grid cells connections as a CellDataArray (dims=(cell_index, vertex_index)). That is,cells[i, :]stores indices of 3/4 points composing the i-th triangle/tetrahedron.values: data values at each grid point as a IndexedDataArray (dims=(index,)).
Additionally, TriangularGridDataset stores two more parameters normal_axis and normal_pos which define the planar grid normal and position of the grid along that direction in 3d.
[1]:
import matplotlib.pyplot as plt
import numpy as np
import tidy3d as td
Let us create simple instances of both classes.
[2]:
tri_grid_points = td.PointDataArray(
    [[0.0, 0.0], [1.0, 0.0], [0.0, 1.0], [1.0, 1.0]],
    dims=["index", "axis"],
)

tri_grid_cells = td.CellDataArray(
    [[0, 1, 2], [1, 2, 3]],
    coords=dict(cell_index=np.arange(2), vertex_index=np.arange(3)),
)

tri_grid_values = td.IndexedDataArray(
    [1.0, 2.0, 3.0, 4.0], coords=dict(index=np.arange(4)), name="triangular"
)

tri_grid = td.TriangularGridDataset(
    normal_axis=1,
    normal_pos=0,
    points=tri_grid_points,
    cells=tri_grid_cells,
    values=tri_grid_values,
)
[3]:
tet_grid_points = td.PointDataArray(
    [
        [0.0, 0.0, 0.0],
        [1.0, 0.0, 0.0],
        [0.0, 1.0, 0.0],
        [1.0, 1.0, 0.0],
        [0.0, 0.0, 1.0],
        [1.0, 0.0, 1.0],
        [0.0, 1.0, 1.0],
        [1.0, 1.0, 1.0],
    ],
    coords=dict(index=np.arange(8), axis=np.arange(3)),
)

tet_grid_cells = td.CellDataArray(
    [[0, 1, 3, 7], [0, 1, 5, 7], [0, 4, 5, 7], [0, 2, 3, 7], [0, 2, 6, 7], [0, 4, 6, 7]],
    coords=dict(cell_index=np.arange(6), vertex_index=np.arange(4)),
)

tet_grid_values = td.IndexedDataArray(
    [1.0, 2.0, 3.0, 4.0, 2.0, 4.0, 6.0, 8.0], coords=dict(index=np.arange(8)), name="tetrahedral"
)

tet_grid = td.TetrahedralGridDataset(
    points=tet_grid_points,
    cells=tet_grid_cells,
    values=tet_grid_values,
)
Another convenient way of initializing unstructured grids is by reading them from vtk files containing vtkUnstructuredGrid.
[4]:
heat_data = td.TetrahedralGridDataset.from_vtu("misc/unstructured_grid.vtu")
Naming#
Note that dataset’s name is passed through values array. For convenience, calling .name automatically returns this name.
[5]:
print(tri_grid.name, tet_grid.name)
triangular tetrahedral
Datasets can be renamed using .rename() method.
[6]:
tri_grid_new = tri_grid.rename("new_name")
print(tri_grid_new.name)
new_name
Note that just like other DataArray classes, the name will not be saved when data is exported into an hdf file.
Slicing and Plotting#
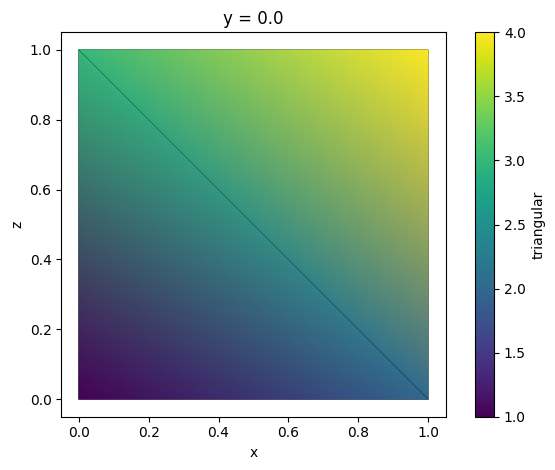
TriangularGridDataset can be directly visualized using function .plot().
[7]:
tri_grid.plot()
plt.show()
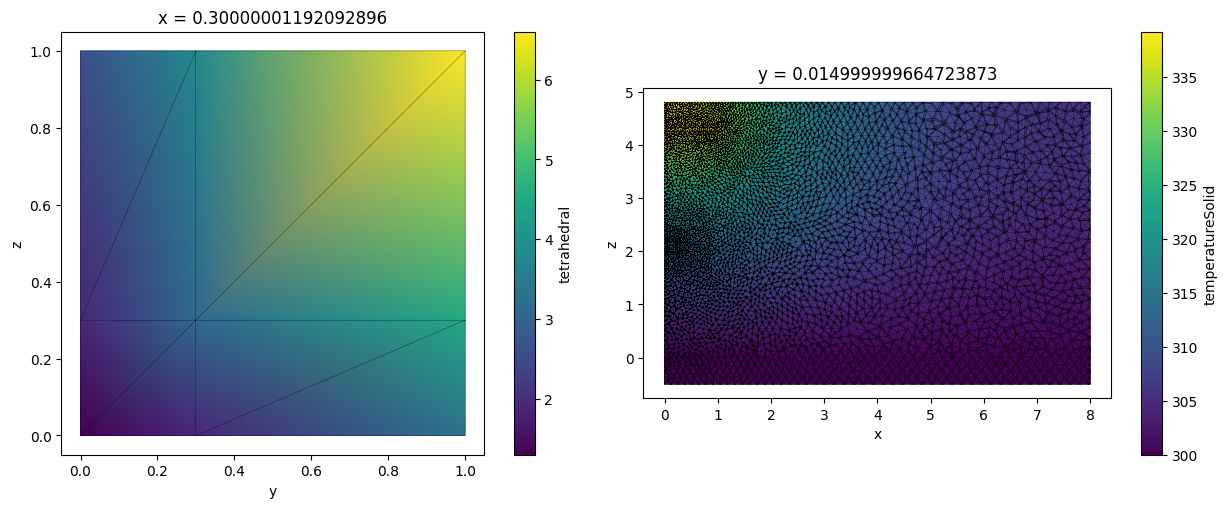
To visually inspect TetrahedralGridDataset one first needs to slice it along a plane. This creates a new TriangularGridDataset representing the grid slice. Note that slicing a tetrahedral grid might produce non-triangular polygons. Those are automatically triangulated.
[8]:
tet_grid_slice = tet_grid.plane_slice(axis=0, pos=0.3)
heat_data_slice = heat_data.plane_slice(axis=1, pos=0.015)

_, ax = plt.subplots(1, 2, figsize=(13, 5))
tet_grid_slice.plot(ax=ax[0])
heat_data_slice.plot(ax=ax[1])
plt.tight_layout()
plt.show()
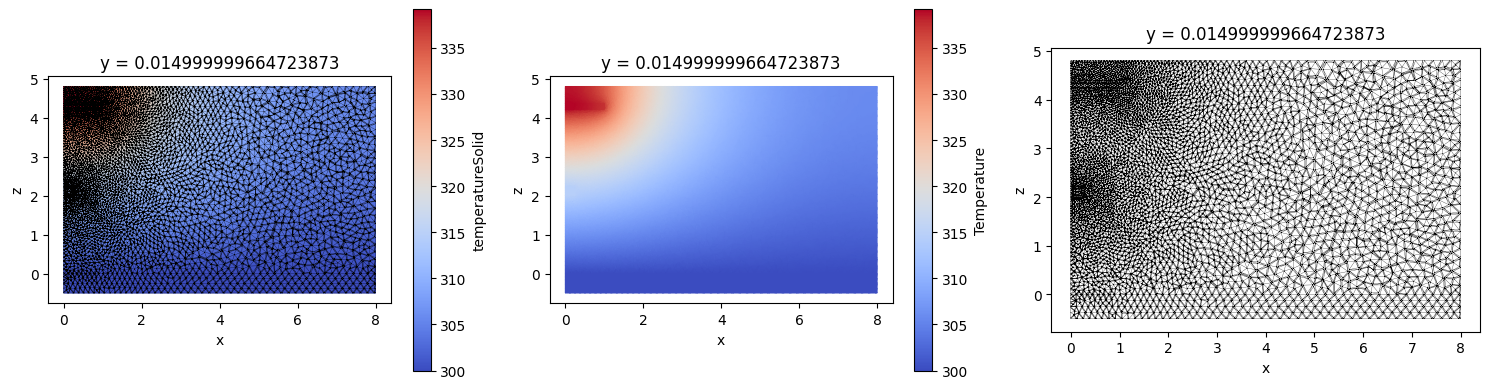
By default both data and unstructured grid are plotted. Using boolean arguments grid and field plotting of either can be turned off.
[9]:
_, ax = plt.subplots(1, 3, figsize=(15, 4))
heat_data_slice.plot(ax=ax[0], cmap="coolwarm")
heat_data_slice.plot(ax=ax[1], grid=False, cmap="coolwarm", cbar_kwargs={"label": "Temperature"})
heat_data_slice.plot(ax=ax[2], field=False)
plt.tight_layout()
plt.show()
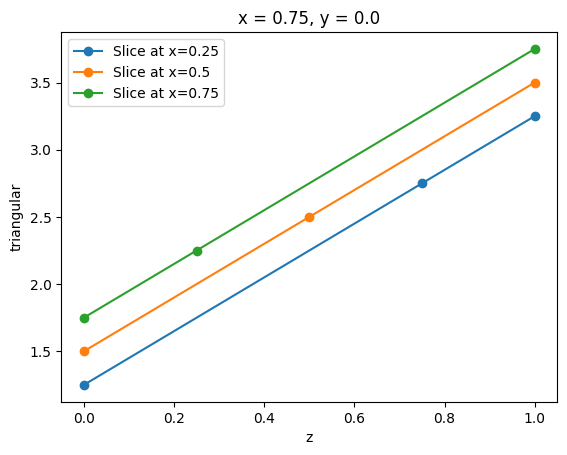
TriagnularGridDataset similarly has a method .plane_slice and the result of this operation is a line represented as a SpatialDataArray. Note that the slicing plane must be perpendicular to the grid plane.
[10]:
_, ax = plt.subplots(1, 1)

for x_pos in [0.25, 0.5, 0.75]:
    tri_grid_slice = tri_grid.plane_slice(axis=0, pos=x_pos)
    assert tri_grid_slice.name == tri_grid.name
    tri_grid_slice.plot(ax=ax, marker="o", label=f"Slice at x={x_pos}")

plt.legend()
plt.show()
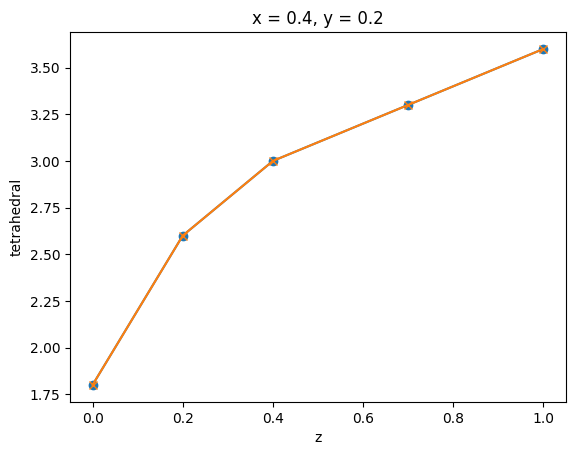
A line slice from a tetrahedral grid can be obtained directly using method .line_slice(). This is similar to performing two plane slices.
[11]:
tet_grid_line_slice = tet_grid.line_slice(axis=2, pos=[0.4, 0.2, 0])
tet_grid_line_slice2 = tet_grid.plane_slice(axis=0, pos=0.4).plane_slice(axis=1, pos=0.2)

_, ax = plt.subplots(1, 1)
tet_grid_line_slice.plot(ax=ax, marker="o")
tet_grid_line_slice2.plot(ax=ax, marker="x")
plt.show()
Note that attempting to slice a grid out of bounds causes an error.
[12]:
try:
    _ = tet_grid.plane_slice(axis=2, pos=2)
except:
    print("Error")

try:
    _ = tet_grid.line_slice(axis=1, pos=(3, 3, 3))
except:
    print("Error again")
13:19:17 CEST ERROR: Slicing plane (axis: 2, pos: 2) does not intersect the
              unstructured grid (extent along axis 2: 0.0, 1.0).
Error
ERROR: Slicing line does not intersect the unstructured grid.
Error again
Clipping#
Both datasets support method .box_clip() that clip grid data by a box.
[13]:
clip_bounds = [[0, -2.5, 1], [3, 2.5, 5]]
heat_data_clipped = heat_data.box_clip(bounds=clip_bounds)
heat_data_slice_clipped = heat_data_slice.box_clip(bounds=clip_bounds)

_, ax = plt.subplots(1, 2, figsize=(10, 5))

heat_data_clipped.plane_slice(axis=1, pos=0.01).plot(ax=ax[0])
heat_data_slice_clipped.plot(ax=ax[1])

plt.tight_layout()
plt.show()
Similarly to slicing, if the clipping box does not intersect the unstructured grid an error occurs.
[14]:
try:
    _ = heat_data.box_clip(bounds=[[0, 1.5, 1], [3, 2.5, 5]])
except:
    print("Error")
13:19:18 CEST ERROR: Clipping box does not intersect the unstructured grid.
Error
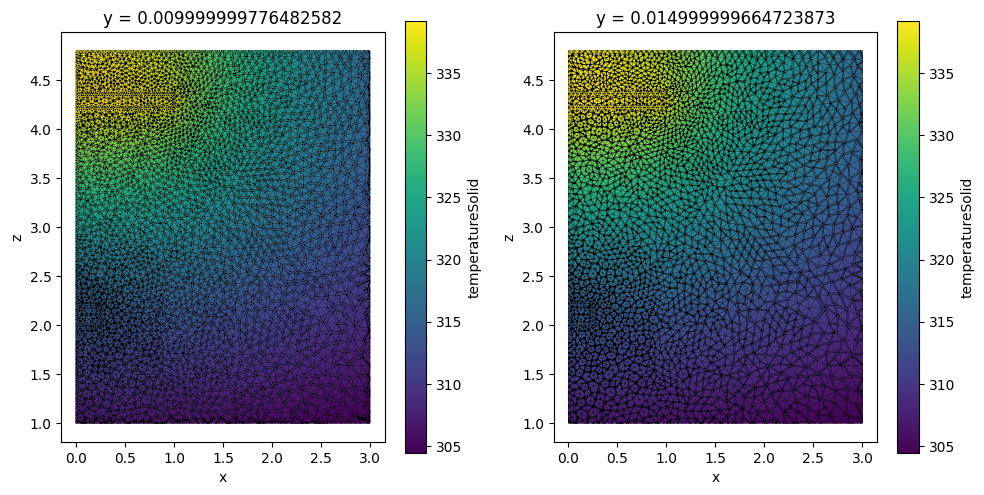
Interpolation#
Both methods support method .interp() that performs interpolation from an unstructured grid to a Cartesian grid defined by provided x, y, and z coordinates. The results are returned in as a SpatialDataArray. Note that performing interpolation into three dimensional Cartesian grid with many points may be slow. Points outside of unstructured grids are assigned to value provided as
fill_value (default: 0). It can be set to “extrapolate” to fill outside points by nearest values. Note that data stored TriangularGridDataset is assumed to be invariant along the normal direction to the grid plane
[15]:
heat_data_interpolated = heat_data.interp(
x=np.linspace(0, 3, 20),
y=np.linspace(-2.5, 2.5, 11),
z=np.linspace(1, 5, 30),
fill_value=300,
)
heat_data_slice_interpolated = heat_data_slice.interp(
x=np.linspace(0, 3, 20),
y=[0.01, 0.02],
z=np.linspace(1, 5, 30),
fill_value="extrapolate",
)
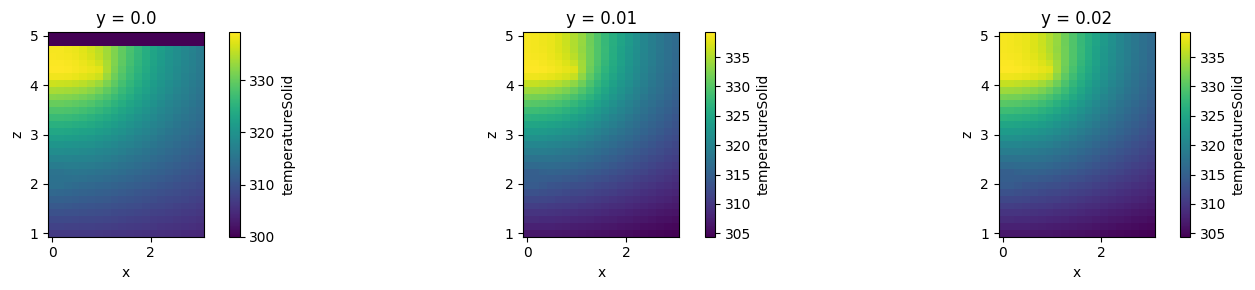
_, ax = plt.subplots(1, 3, figsize=(15, 3))
heat_data_interpolated.sel(y=0.01, method="nearest").plot(ax=ax[0], x="x")
heat_data_slice_interpolated.sel(y=0.01, method="nearest").plot(ax=ax[1], x="x")
heat_data_slice_interpolated.sel(y=0.02, method="nearest").plot(ax=ax[2], x="x")
ax[0].set_aspect("equal")
ax[1].set_aspect("equal")
ax[2].set_aspect("equal")
plt.tight_layout()
plt.show()
General .sel() Methods#
For convenience the above slicing and extraction methods are wrapped by a single method .sel() that takes up to three arguments x, y, and z. The following are equivalence rules for TetrahedralGridDataset:
.selwith one argument ==.plane_slice().selwith two arguments ==.line_slice().selwith all three arguments ==.interp()
Similarly, for TriangularGridDataset (provided argument along normal axis is not provided):
.selwith one argument ==.plane_slice().selwith two arguments ==.interp()
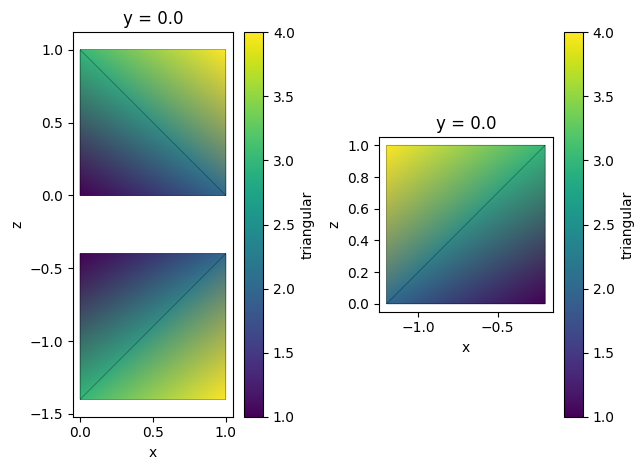
Reflection#
Unstructured datasets can be easily reflected around a given plane. By default, this operation extends data, that is, the original data is preserved. Setting reflection_only=True will result in returning only reflected part.
[16]:
tri_grid_extend = tri_grid.reflect(axis=2, center=-0.2)
tri_grid_reflect = tri_grid.reflect(axis=0, center=-0.1, reflection_only=True)

_, ax = plt.subplots(1, 2)
tri_grid_extend.plot(ax=ax[0])
tri_grid_reflect.plot(ax=ax[1])

plt.tight_layout()
plt.show()
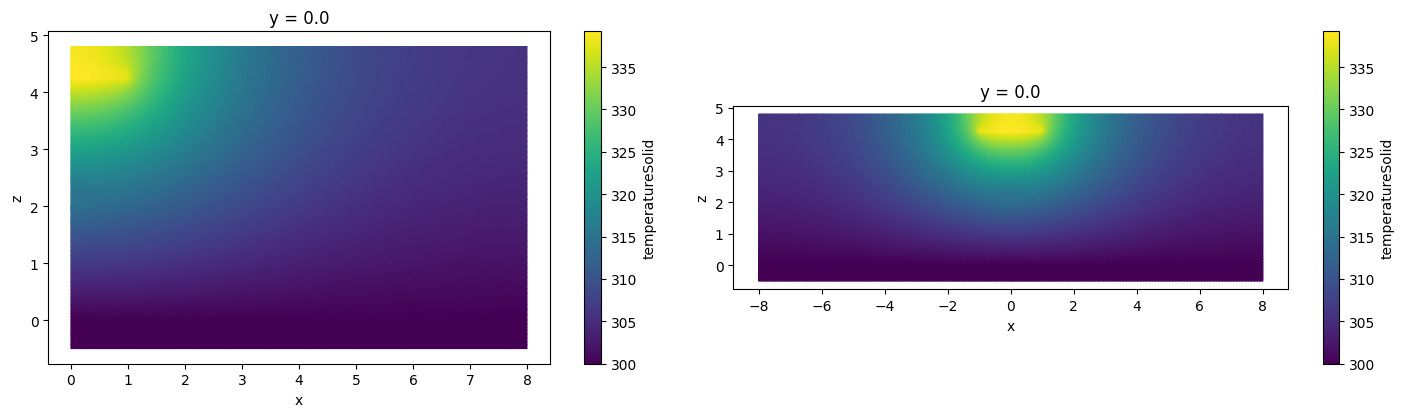
A more representative example.
[17]:
heat_data_extended = heat_data.reflect(axis=0, center=0)

_, ax = plt.subplots(1, 2, figsize=(15, 4))
heat_data.sel(y=0).plot(grid=False, ax=ax[0])
heat_data_extended.sel(y=0).plot(grid=False, ax=ax[1])

plt.tight_layout()
plt.show()
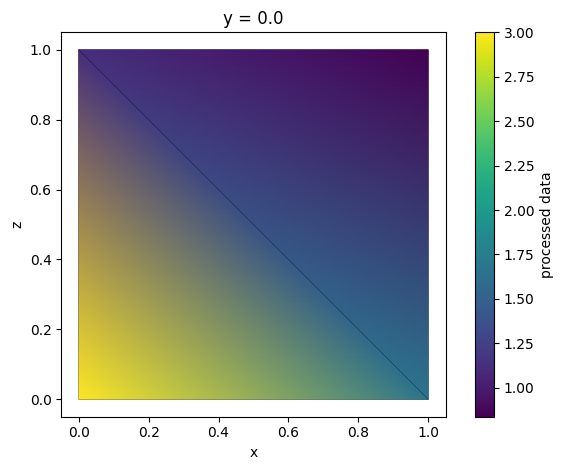
Arithmetic Operations#
Mathematical operations on unstructured arrays are interpreted as operations on their .values field. Thus, performing operations on field data is straightforward.
[18]:
new_data = (tri_grid * 2 + tri_grid.abs + np.log(tri_grid)) / tri_grid**2
new_data = new_data.rename("processed data")
new_data.plot()
plt.show()
Reading and Writing#
As any other Tidy3D dataset these datasets can be written and read into/from .hdf5 files. We also already saw method .from_vtk() that allow to initialize an unstructured dataset directly from a vtk file. Additionally, an unstructured dataset can be directly written into a vtk file using .to_vtk(). This could be useful when one desires to inspect a given unstructured data in another, perhaps more advanced, visualization software.
[19]:
tri_grid.to_vtu("tri_grid_test.vtu")
tet_grid.to_vtu("tet_grid_test.vtu")

tri_grid_loaded = td.TriangularGridDataset.from_vtu("tri_grid_test.vtu")
tet_grid_loaded = td.TetrahedralGridDataset.from_vtu("tet_grid_test.vtu")

assert tri_grid == tri_grid_loaded
assert tet_grid == tet_grid_loaded